Tidyverse dplyr and ggplot2: How to Manipulate and Visualize Data Easily in R

R is a popular programming language and free software environment for statistical computing and visualization. The language and software is widely used among statisticians and data miners for developing statistical software and data analysis. This tutorial is designed to give the reader a quick start on their journey with R. The intended audience is someone with a basic understanding of data analysis and programming languages. The tutorial is mainly divided into two parts: Data manipulation and visualization. The data manipulation portion explains how to use base R functions and the dplyr package to clean, reformat, subset, and summarize the data in various ways. The visualization portion explains how to use the ggplot2 package to create interesting visualizations of the data that was manipulated. The tutorial clearly explains the common uses of each function by applying them to a focus dataset. Thus, the code from this tutorial can be adapted for data manipulation and visualization for any data set.
Network Visualization: The relationships between beer

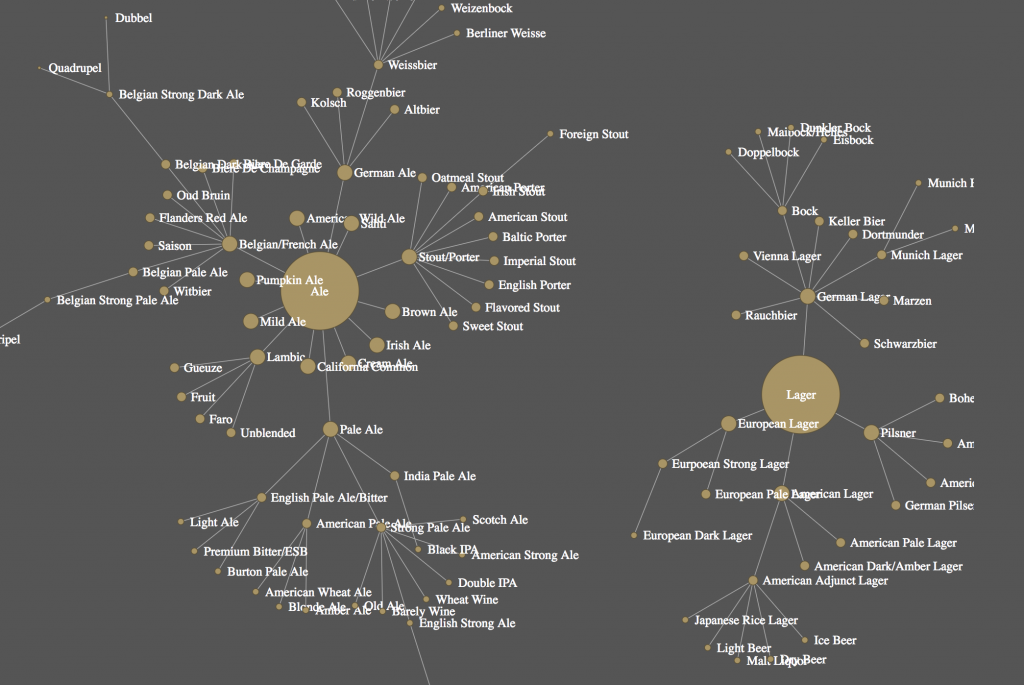
This tutorial will walk through the steps to build an interactive network visualization. The theme we visualize in the example is the web-network of different types of beer and their relationships to each other. The beer visualization illustrates how all beers are related from two common parents: Ales and Lagers.

https://clarkdatalabs.github.io/web_network_visualization/

Beer Relationships

Text Mining and Self Organizing Maps: Visualizing Shakespeare

After my previous exploration of Self Organizing Maps, I decided to use the tool for an application of text mining: Can we visualize how Shakespeare’s characters and plays are similar or different from each other based on an analysis of their words?

This tutorial walks through a couple examples using R and suggests some further exploration. It’s split into two sequential parts:

Self Organizing Maps and Text Mining – Visualizing Shakespeare (Part 1)

Self Organizing Maps and Text Mining – Visualizing Shakespeare (Part 2)


Introduction to Self Organizing Maps in R

This semester I’ve been playing around with Self Organizing Maps (SOMs) using the “kohonen” package in R. SOMs allow you to visualize very high dimensional data in a simplified two dimensional map which preserves proximity. I’ve written up an introductory tutorial on getting started making SOMs using the kohonen package:

https://clarkdatalabs.github.io/soms/SOM_NBA

This workshop plays around with NBA player stats from the 2015/2016 season. Disclaimer: I know next to nothing about basketball.

Self Organizing Map depicting NBA Player Position Predictions

If you like this post, keep an eye out for the next one. In the next month I’ll put out a tutorial on using SOMs to visualize the text-mined works of Shakespeare. Disclaimer: I know next to nothing about the works of Shakespeare.


Creating R Tutorials Using RMarkdown: Code Chunk Options

Two of us here in the Digital Project Studio have recently been working through an R script developed for a workshop on doing some basic mapping in R. The goal was to turn the script, which was used alongside in-person instruction, into a usable self-directed tutorial.  To do this we used R Markdown, an authoring platform that turns R scripts into reproducible and dynamic documents, presentations, and webpages. Our introductory tutorial will get you set up and started to using R Markdown. On this post we’ll share some of the additional features we’ve learned using this platform.

To find the actual R mapping workshop we created, the instructions and file downloads are accessible here: http://clarkdatalabs.github.io/mapping_R/

In the zipped file package you can find our R Markdown file for creating the instructions of the workshop: script_markup.Rmd

Continue reading “Creating R Tutorials Using RMarkdown: Code Chunk Options”

Migrating From PHP to Django

Introduction

A recent project I’ve been working on in the Digital Projects Studio has been moving a website built in PHP to Django. To understand why we’d go through the headache of moving the site into Django it’d be good to first understand some of the scope of the project.

Continue reading “Migrating From PHP to Django”

Customizing Applications in Django

This post is a follow-up to the introduction to the Field Notebook and the demo notebook, ‘Monumental Gifts’. I will go over how to install the app and start customizing your own web-based Field Notebook. This post will focus on how to start tailoring the models and appearance of your Notebook to suit your needs for your research. If you are interested (or discover later that you are interested) in building your own original application from scratch, I recommend working through the Beginner’s Tutorial on Django’s website. In fact, even if you don’t plan on building your own application, I still recommend the tutorial. You’ll have better understanding of how to modify and use your Field Notebook if you become familiar with how Django works as a framework.

Installing the app

Continue reading “Customizing Applications in Django”

Translating Bootstrap to Django

Introduction

When first learning how to integrate my Bootstrap and Django, I wasn’t able to find a quick cheat sheet to reference without visiting different documentation pages. To help others I’ve put together a list below of the tags I used most often. A full list of Django tags and filters can be found here.

Continue reading “Translating Bootstrap to Django”

Django For Digital Humanities

Introduction

A few weeks ago a researcher came to the Digital Projects Studio for help in getting his research out to a larger audience. His project, on Jewish cafes, had a plethora of information ranging from details on the cafes themselves to the cities and the famous people who had frequented the cafes. Some of the cafes had been destroyed during World War II and others are still in existence today. This is the story of bringing the Jewish Cafes project online.

Continue reading “Django For Digital Humanities”