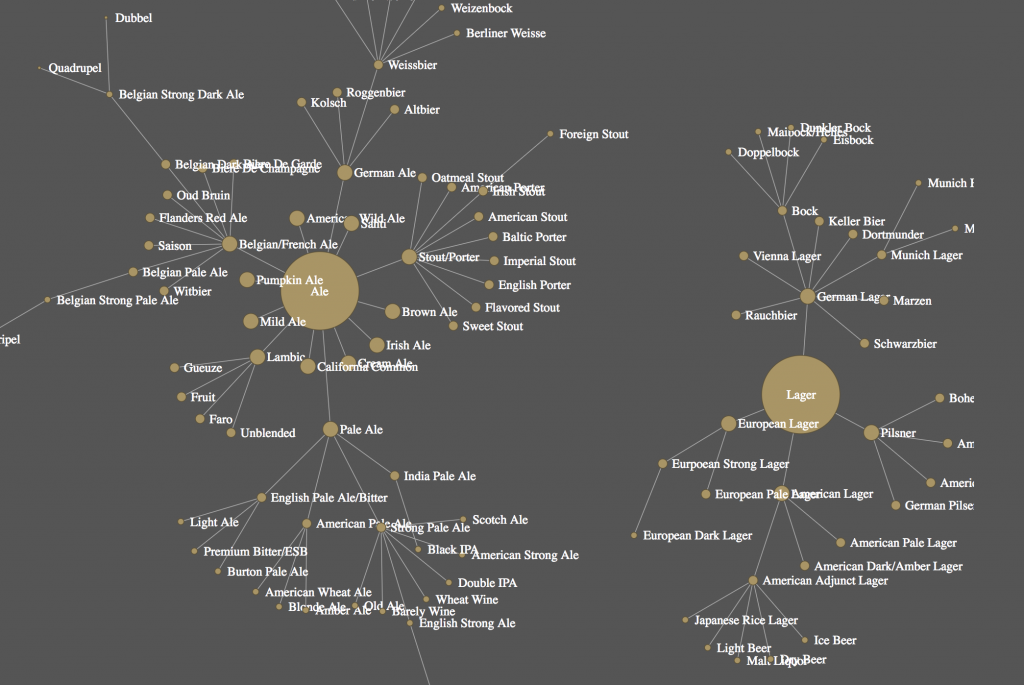
This tutorial will walk through the steps to build an interactive network visualization. The theme we visualize in the example is the web-network of different types of beer and their relationships to each other. The beer visualization illustrates how all beers are related from two common parents: Ales and Lagers.
https://clarkdatalabs.github.io/web_network_visualization/