Derrida: Visualization of Derrida’s Margin in D3

Jacques Derrida is one of the major figures of twentieth-century thought, and his library – which bears the traces of decades of close reading – represents a major intellectual archive. The Princeton University Library (PUL) houses Derrida’s Margins, a website and online research tool for the annotations of Jacques Derrida. We used data collected from this project to create visualizations of the references used throughout Derrida’s De la grammatologie.

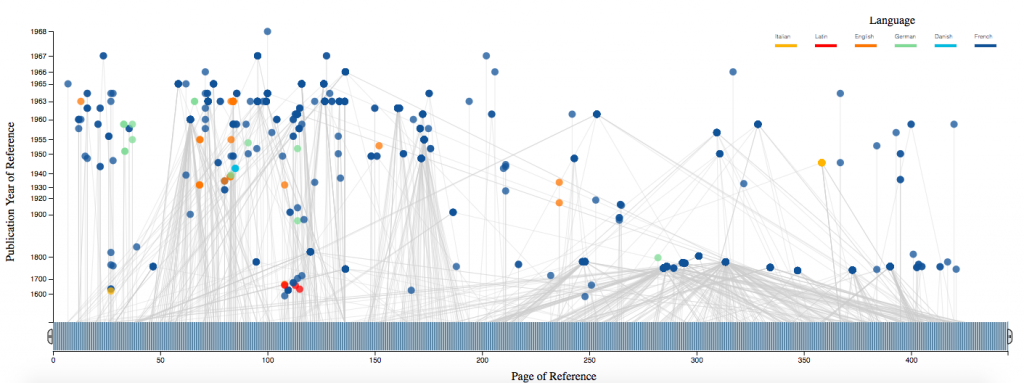
In this interactive visualization for Derrida’s De la grammatologie we represent each book referenced (nodes) and the locations where each book is referenced in the work (lines connecting nodes to the x-axis). The x-axis represents De la grammatologie from start to finish, and the y-axis represents the years in which each referenced book was published. The color of each node indicates the language in which each referenced book was published, and the position of each node is an averaged position among the pages at which the node was references in De la grammatologie. A brush tool is implemented along the x-axis to select ranges of De la grammatologie and references made within the selected range. By mousing over each node, the book title, author, and publication year are displayed.

This code can be adapted to create an interactive visualization for any data set, either for book references or another type, which includes many entries, an x-axis location for each entry, a y-axis location for each entry, and information to display with the mouse-over feature. The interactive and visual components are most interesting when entries are not discrete, and can be connected with a significant frequency to many locations along the x-axis.
 

Mapping with D3: Library of Congress books over time

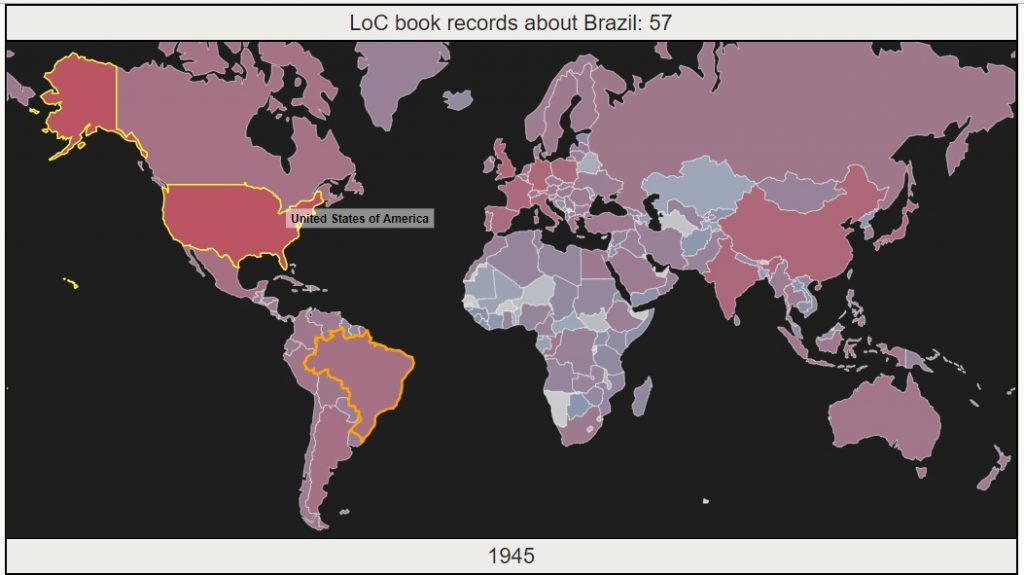
In May 2017, the US Library of Congress made the largest release of digital records in its history – metadata for over 25 million books, maps and recordings. People immediately started making some pretty cool visualizations to explore patterns in the data, or demonstrate the incredible size of the release. This page follows my process of building an animated D3 map visualization, from data cleaning to adding features. Each of the pages below covers one step in the process. Jump to the last page to explore the visualization.

  1. Preparing the Data – Parse massive xml record files, cache and geocode subject locations, aggregate for our visualization.
  2. Basic Animation – Build a D3 map that animates changing numbers of records about each country over time.
  3. Add a Tooltip – Add a tooltip to display country name on hovering. Select a country on click to show record counts for that country.


Still frame of the animated map created in this project.

Network Visualization: The relationships between beer

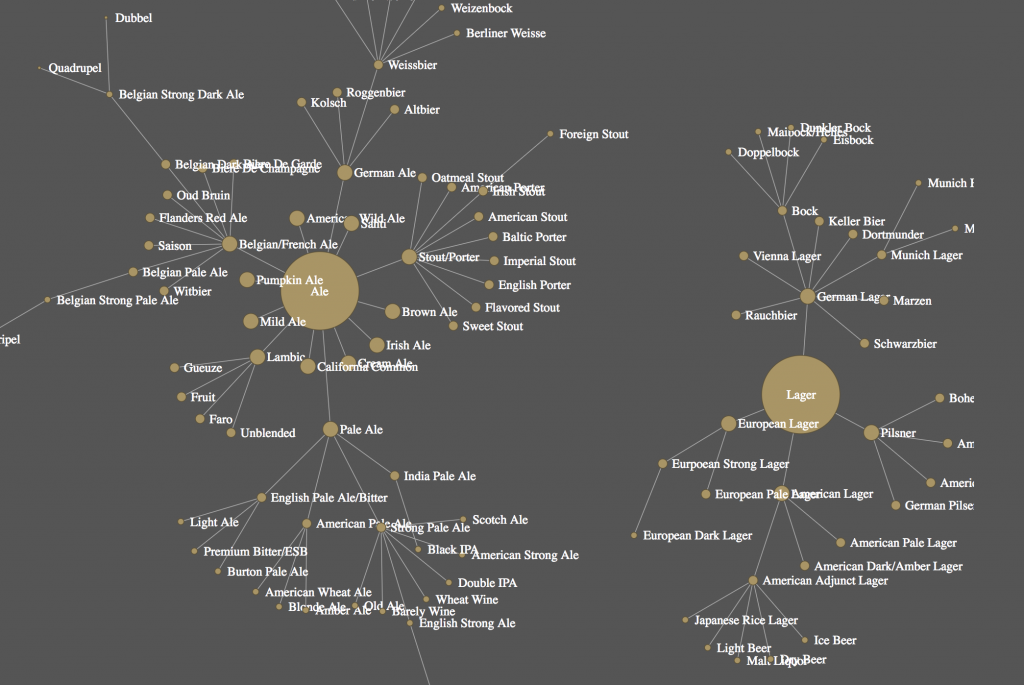
This tutorial will walk through the steps to build an interactive network visualization. The theme we visualize in the example is the web-network of different types of beer and their relationships to each other. The beer visualization illustrates how all beers are related from two common parents: Ales and Lagers.

https://clarkdatalabs.github.io/web_network_visualization/

Beer Relationships

Creating R Tutorials Using RMarkdown: Code Chunk Options

Two of us here in the Digital Project Studio have recently been working through an R script developed for a workshop on doing some basic mapping in R. The goal was to turn the script, which was used alongside in-person instruction, into a usable self-directed tutorial.  To do this we used R Markdown, an authoring platform that turns R scripts into reproducible and dynamic documents, presentations, and webpages. Our introductory tutorial will get you set up and started to using R Markdown. On this post we’ll share some of the additional features we’ve learned using this platform.

To find the actual R mapping workshop we created, the instructions and file downloads are accessible here: http://clarkdatalabs.github.io/mapping_R/

In the zipped file package you can find our R Markdown file for creating the instructions of the workshop: script_markup.Rmd

Continue reading “Creating R Tutorials Using RMarkdown: Code Chunk Options”

Listening to the Web Crawl: Making Music Out of Web Crawling Data Using SuperCollider

SuperCollider is free and open-source software that allows users to generate audio programmatically, including from messages sent over a local server. In our first project as data visualization interns, we used Python to crawl the web and collect parameters, which we passed to SuperCollider to generate music. Continue reading “Listening to the Web Crawl: Making Music Out of Web Crawling Data Using SuperCollider”