Mapping with D3: Library of Congress books over time

In May 2017, the US Library of Congress made the largest release of digital records in its history – metadata for over 25 million books, maps and recordings. People immediately started making some pretty cool visualizations to explore patterns in the data, or demonstrate the incredible size of the release. This page follows my process of building an animated D3 map visualization, from data cleaning to adding features. Each of the pages below covers one step in the process. Jump to the last page to explore the visualization.

  1. Preparing the Data – Parse massive xml record files, cache and geocode subject locations, aggregate for our visualization.
  2. Basic Animation – Build a D3 map that animates changing numbers of records about each country over time.
  3. Add a Tooltip – Add a tooltip to display country name on hovering. Select a country on click to show record counts for that country.
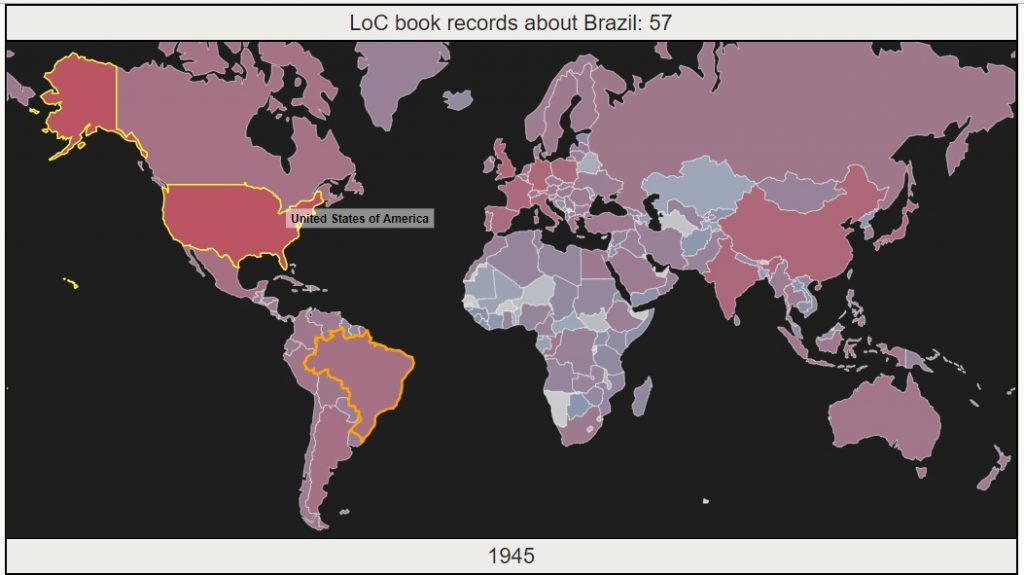
 

Still frame of the animated map created in this project.

Once More, With Feeling: Draws and Drawbacks of Sentiment Analysis

Our Project

Opinions tend to reflect feelings as well as beliefs. Sentiment analysis, also known as opinion mining, is a technique used today for generating data on trends in people’s attitudes and feelings on anything from products and services to current events. This data is created by calculating sentiment scores using what people have said or written. Despite the efforts of computer scientists, semanticists and statisticians to figure out ways to program computers to identify the feelings expressed in words, the technique of sentiment analysis is still at best only reliable as a starting point for closer readings.

The results of sentiment analysis can quickly become misleading if presented without any reference to the actual passages of text that were analyzed. Nevertheless, it is helpful as a technique for delving into large corpora and collections of unstructured texts to capture trends and shifts in sentiment intensity.

For a final collaborative project of the academic year 2015-2016, our team at the Digital Projects Studio decided to take on the challenge of visualizing the intensity of emotions and opinions expressed during the 2016 primary election debates. (Click here to see the final product). Our dataset was a set of complete transcripts for twelve Republican and eight Democratic debates. To process the data, we filtered out interventions of moderators and interjections from the audience, ran the statements of each candidate through a sentiment analyzer from Python’s NLTK (Natural Language ToolKit) library, and indexed the statements of each candidate by debate number, numeric sentiment score, and sentiment category.

Continue reading “Once More, With Feeling: Draws and Drawbacks of Sentiment Analysis”

Django For Digital Humanities

Introduction

A few weeks ago a researcher came to the Digital Projects Studio for help in getting his research out to a larger audience. His project, on Jewish cafes, had a plethora of information ranging from details on the cafes themselves to the cities and the famous people who had frequented the cafes. Some of the cafes had been destroyed during World War II and others are still in existence today. This is the story of bringing the Jewish Cafes project online.

Continue reading “Django For Digital Humanities”

Getting Started: Scraping Twitter Data

Introduction

The aim of this blogpost is for a beginner level user to be able to scrap data from Twitter. In this example, I’ll scrap the 20 most recent statuses from @PureMichigan‘s Twitter feed. My end goal of scraping these posts is to find out quickly who has been talking about @PureMichigan on Twitter most recently and what they are saying. You can also use the count feature to pull up to 200 statuses at a time and analyze the content.
Continue reading “Getting Started: Scraping Twitter Data”