D3.js is a JavaScript library for creating data-driven documents. D3.js helps to visualize data using HTML, SVG, and CSS.This interactive visualization, makes it easier to communicate stories about data. In this blog, we will cover the basic of
In this blog, we will cover the basics of creating a bar chart using a given set of data in D3.js.
What will you need:
- MS Excel – to create a csv file
- A text editor like Sublime text
- XAMPP
Step 1: Create CSV file
Prepare some sample data in excel and save it as a CSV file. Here is some unemployment data for the US in the month of Jan from 2005 to 2015
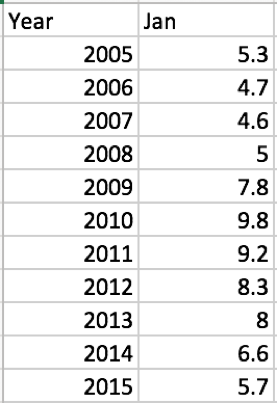
Here, Year and Jan – headers for the two columns will act as properties of data when you bring it in.
Step 2: Create HTML file
Here is the basic template to start off your HTML file. Make sure to save this HTML file in the same folder as your CSV file.
[gist https://gist.github.com/noureend/a4687f25d5c0021d63ad]
Step 3:
In order to do this, you will want to do this on a server as most browsers won’t render it. I am using XAMPP.
The function to fetch the data to D3 is:
[gist https://gist.github.com/noureend/3af22c1e6f00bee9d12c]
Because our data is in a csv file, we call d3.csv. If your data is in json format you could call d3.json.
Then, we specify our arguments.
- The first argument is the path to the data file. Since, my data file is in the same folder as the HTML file, I can just specify the name of the data file.
- The second argument is a callback function.
Step 4: Create a SVG container
We specify the basic size of our SVG container using the attr function
We create a variable called canvas which then becomes a shortcut for calling the code on the right of the equal to sign.
[gist https://gist.github.com/noureend/2967002b5eac58921e13]
Step 5: Creating Bars
It’s now time to add our bars for the bar graph.
[gist https://gist.github.com/noureend/38e6f123a9a0cbd8e3e1]
We refer back to the data that we created earlier as an argument to our callback function. Which in turn references the data stored in our file.
Next, using the enter method we will append a rectangle for each data element and give it some properties (width, height, y position, and color).
You will notice that the width and y position are functions. The reason for this is you want to specify which data property you are referencing with the ‘d’ variable. The “* 10” multiplies the data by 10 and the bars get bigger.
For the ‘y’ attribute is a function of the index. We want to return the index for each data element, then times it by 50.
Step 6: Adding text to the bars
[gist https://gist.github.com/noureend/0c4c53d728117cc6a90c]
To add text, we will append “text”, specify the color of the text. The most important thing here is perhaps the ‘y’ attribute. You want the text of each bar to the at the same position as the bar so that you can see which text belongs where. Therefore, similar to the above, copy the ‘y’ attribute (vertical position for the text).
Lastly, you want to specify what text you want to have. So, let the text property be a function of data and return the ‘Month’ property.
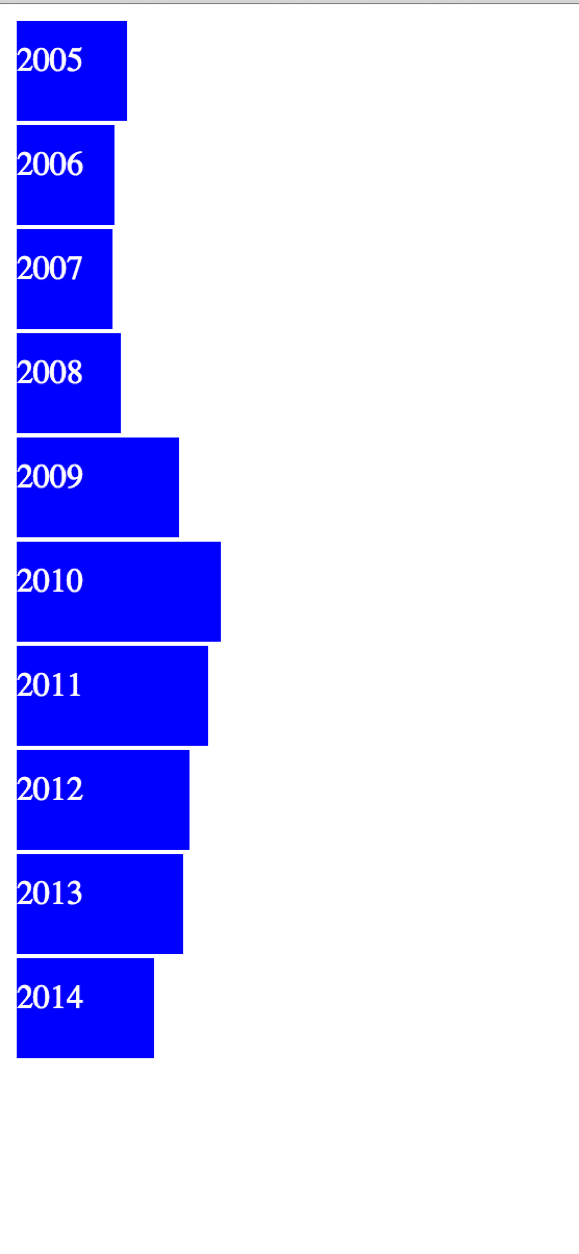
Now, open the file in your browser and you should see this: