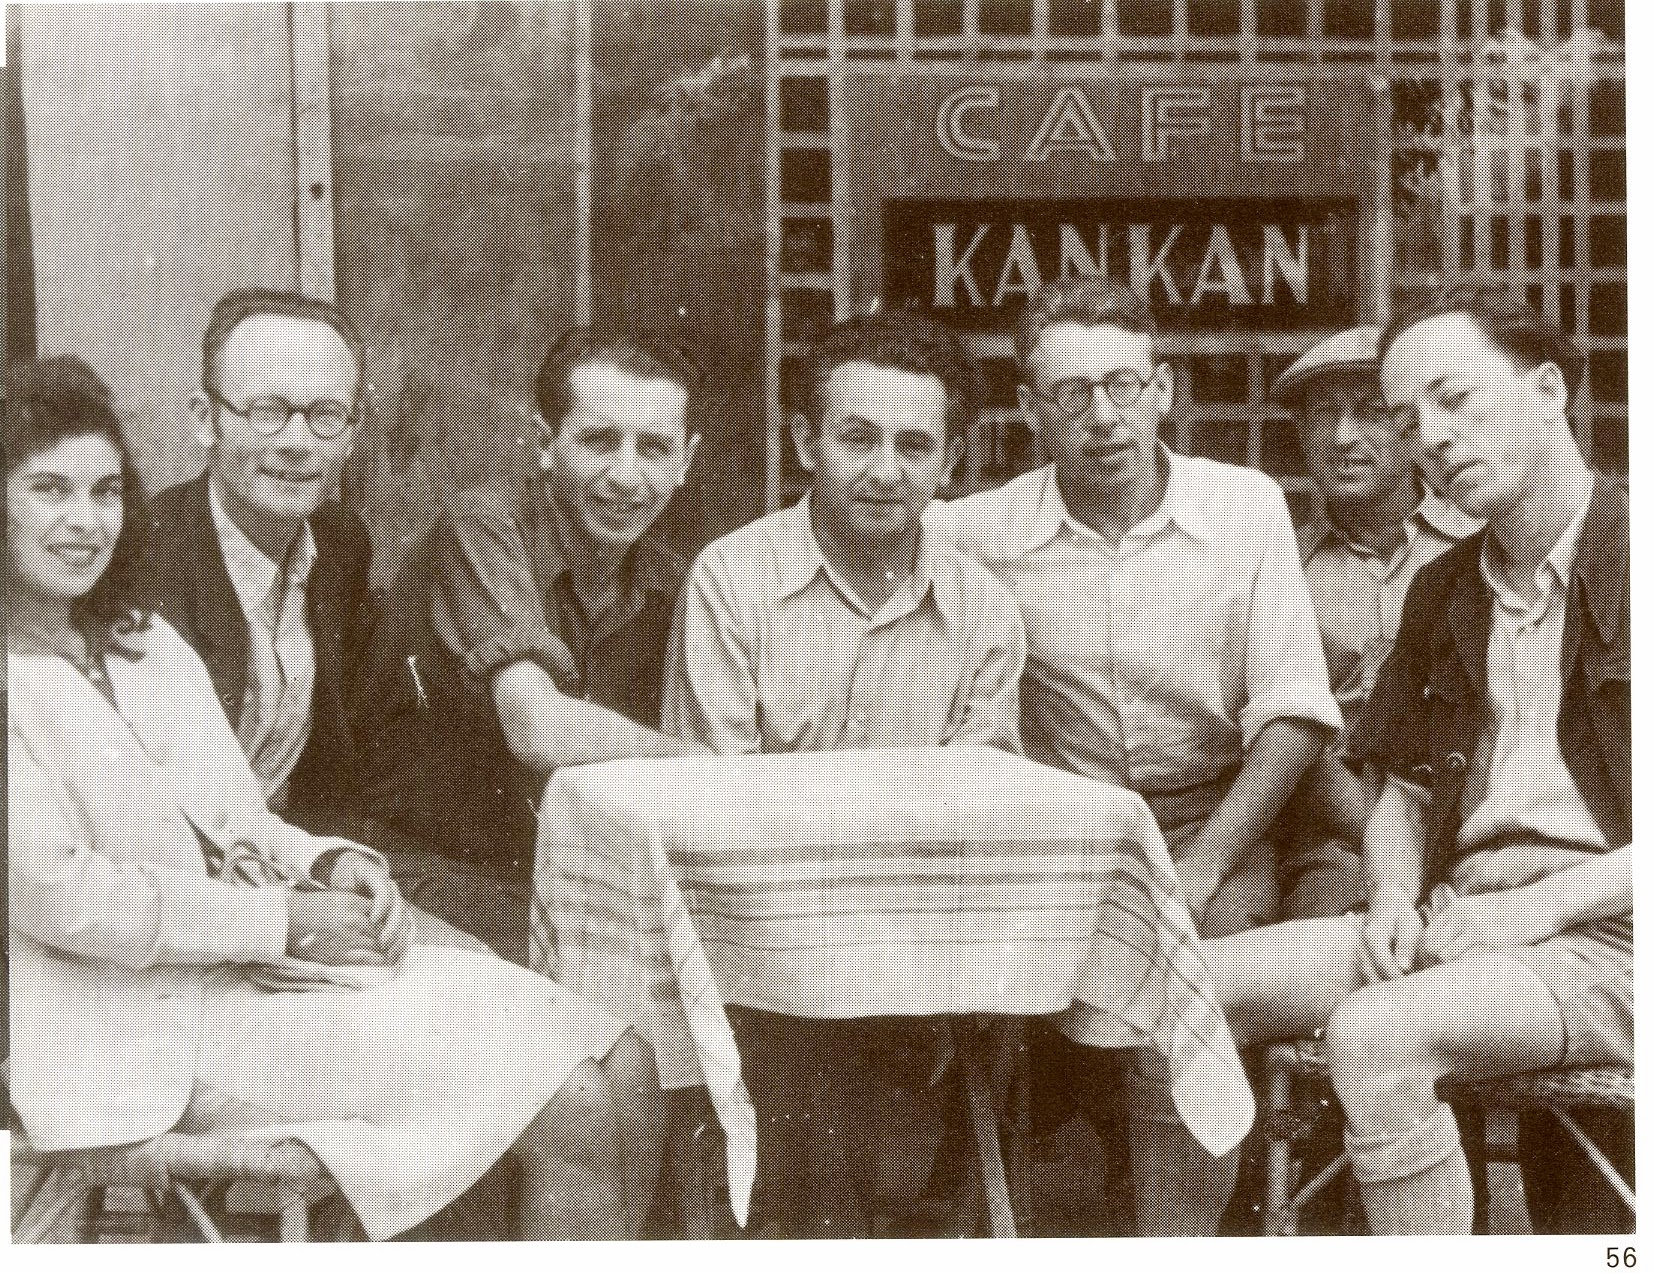
Introduction
A few weeks ago a researcher came to the Digital Projects Studio for help in getting his research out to a larger audience. His project, on Jewish cafes, had a plethora of information ranging from details on the cafes themselves to the cities and the famous people who had frequented the cafes. Some of the cafes had been destroyed during World War II and others are still in existence today. This is the story of bringing the Jewish Cafes project online.
The Researcher’s Needs
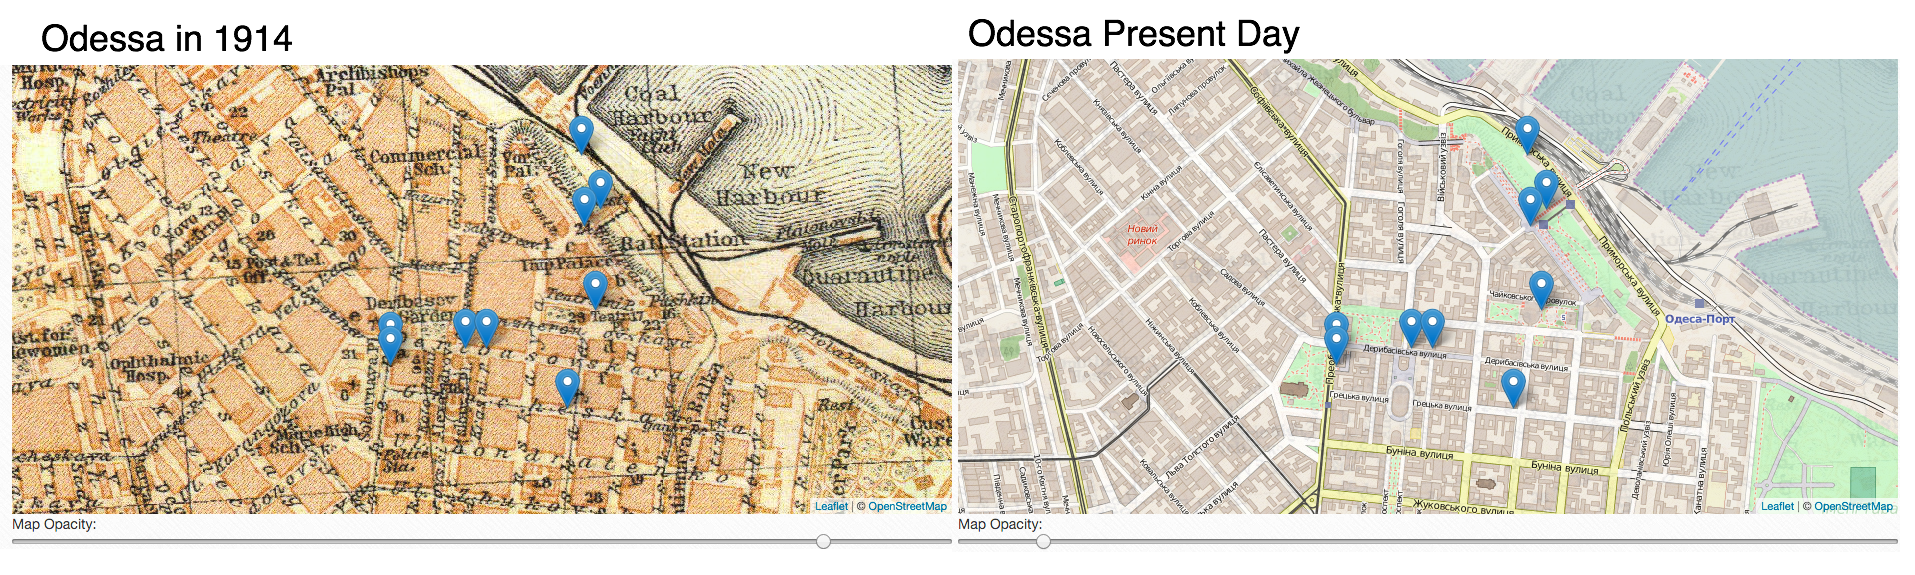
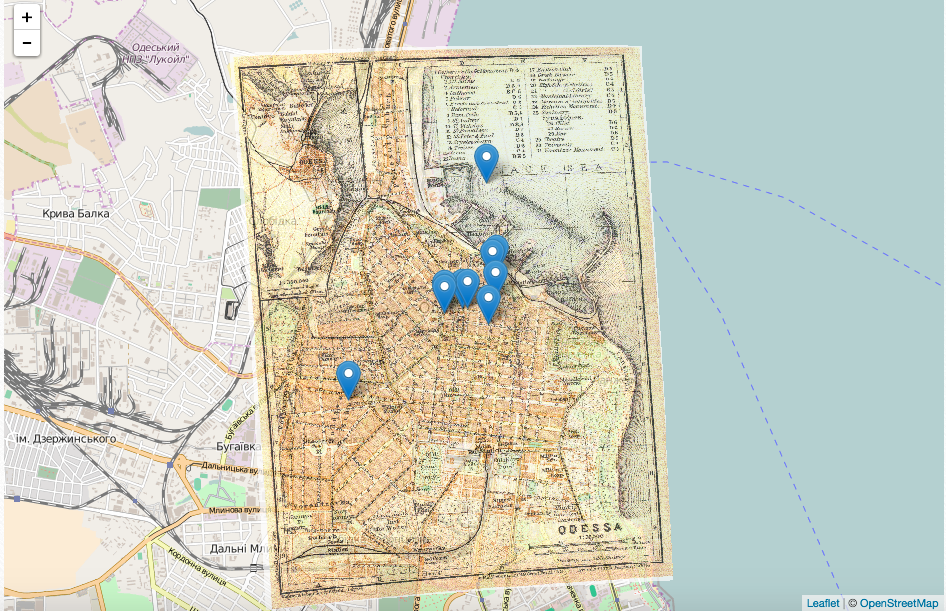
A popular platform at our university to create digital exhibits is called Omeka. Normally researchers would use this system but the Jewish Cafe’s researcher had special needs. For the project, this researcher wanted to create a visual representation of all the cafes on a map that overlaid a historical map with the current map view (see below).
The current university system is not flexible enough to do this nor is the system scalable to different screen sizes. Other needs besides editable map interfaces and accessibility included:
- Finding a platform that could house a large data set
- A platform with a flexible data structure
- A platform that provided easy content upload capabilities so the researcher and students could upload information
Django provided a solution to all these challenges.
Django Solutions
Templatizing Makes Quick Work
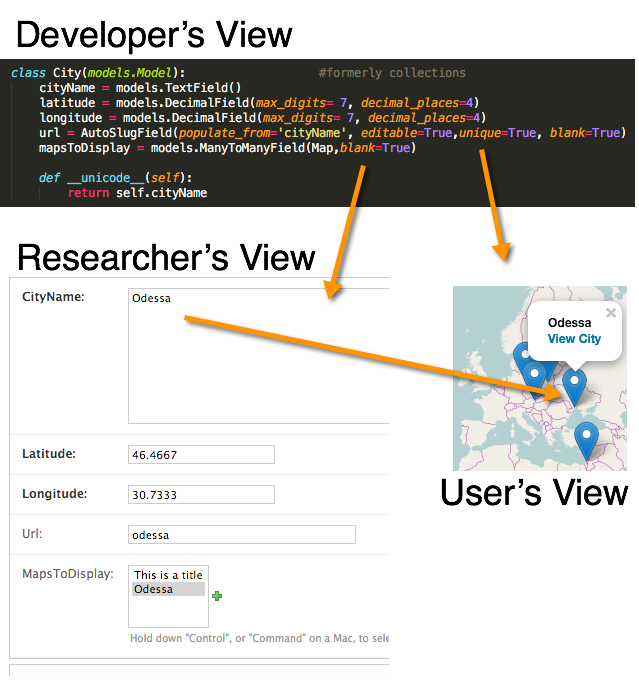
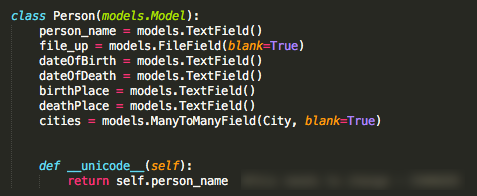
The Django platform is a template system meaning it is made by up of a series of ‘blocks’ (of code) and these blocks can easily be moved to fit the requirements of the project. For example, in our Jewish Cafes project we had a ‘block’ about cities, which included the city’s latitude, longitude, and maps associated with the city. Another ‘block’ included the cafes themselves within the city. So one city could easily have many ‘blocks’ of cafes. This made quick work for the development team because we only had to build a ‘block’ of code once and then it could be easily replicated.
Each point on the User’s View (the map) represents a city. The city was generated using the developer’s code (top) and then the researcher put in the coordinates for each city he had a Jewish Cafe in (see Researcher’s View). These 8 lines of code generated points on the map around the world as the Researcher input the data.
Admin Panel
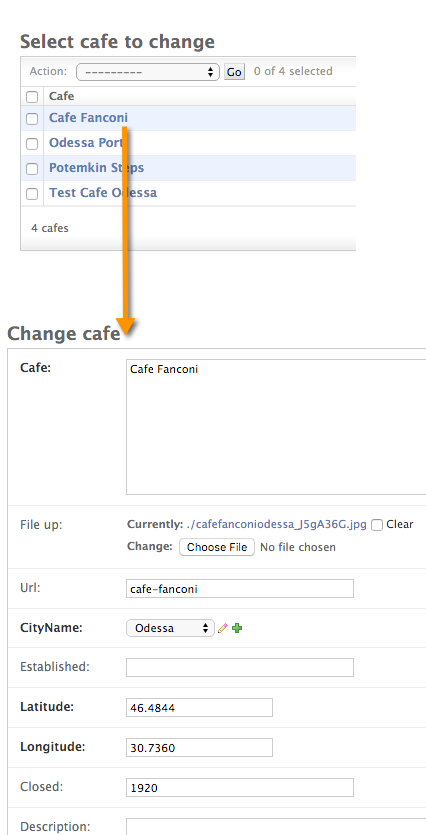
The Admin Panel made the project easier because it provided a friendly interface where the Researcher and students helping with the project could easily input information. Our project screen looked like this:
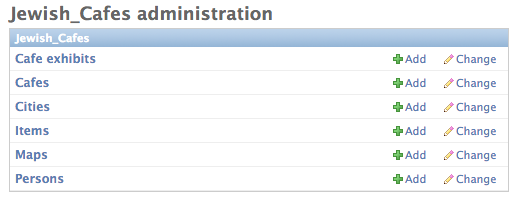
By clicking ‘+Add’ you could add in a new cafe, city, map, etc, or you could click into it further to edit the current content:
Flexible Data Structure
At one point the researcher wanted to add in people who are associated with each cafe as well. Adding another component to the data structure is very easy in Django. It took an extra block of code to be added into the models.py file and the researcher could begin inputting people.
Map Overlays with Leaflet
Using map tiles created within ArcGIS, we overlaid the tiles onto the Leaflet map, so the researcher could pinpoint the cafes in how the cities were formerly and are currently are laid out.
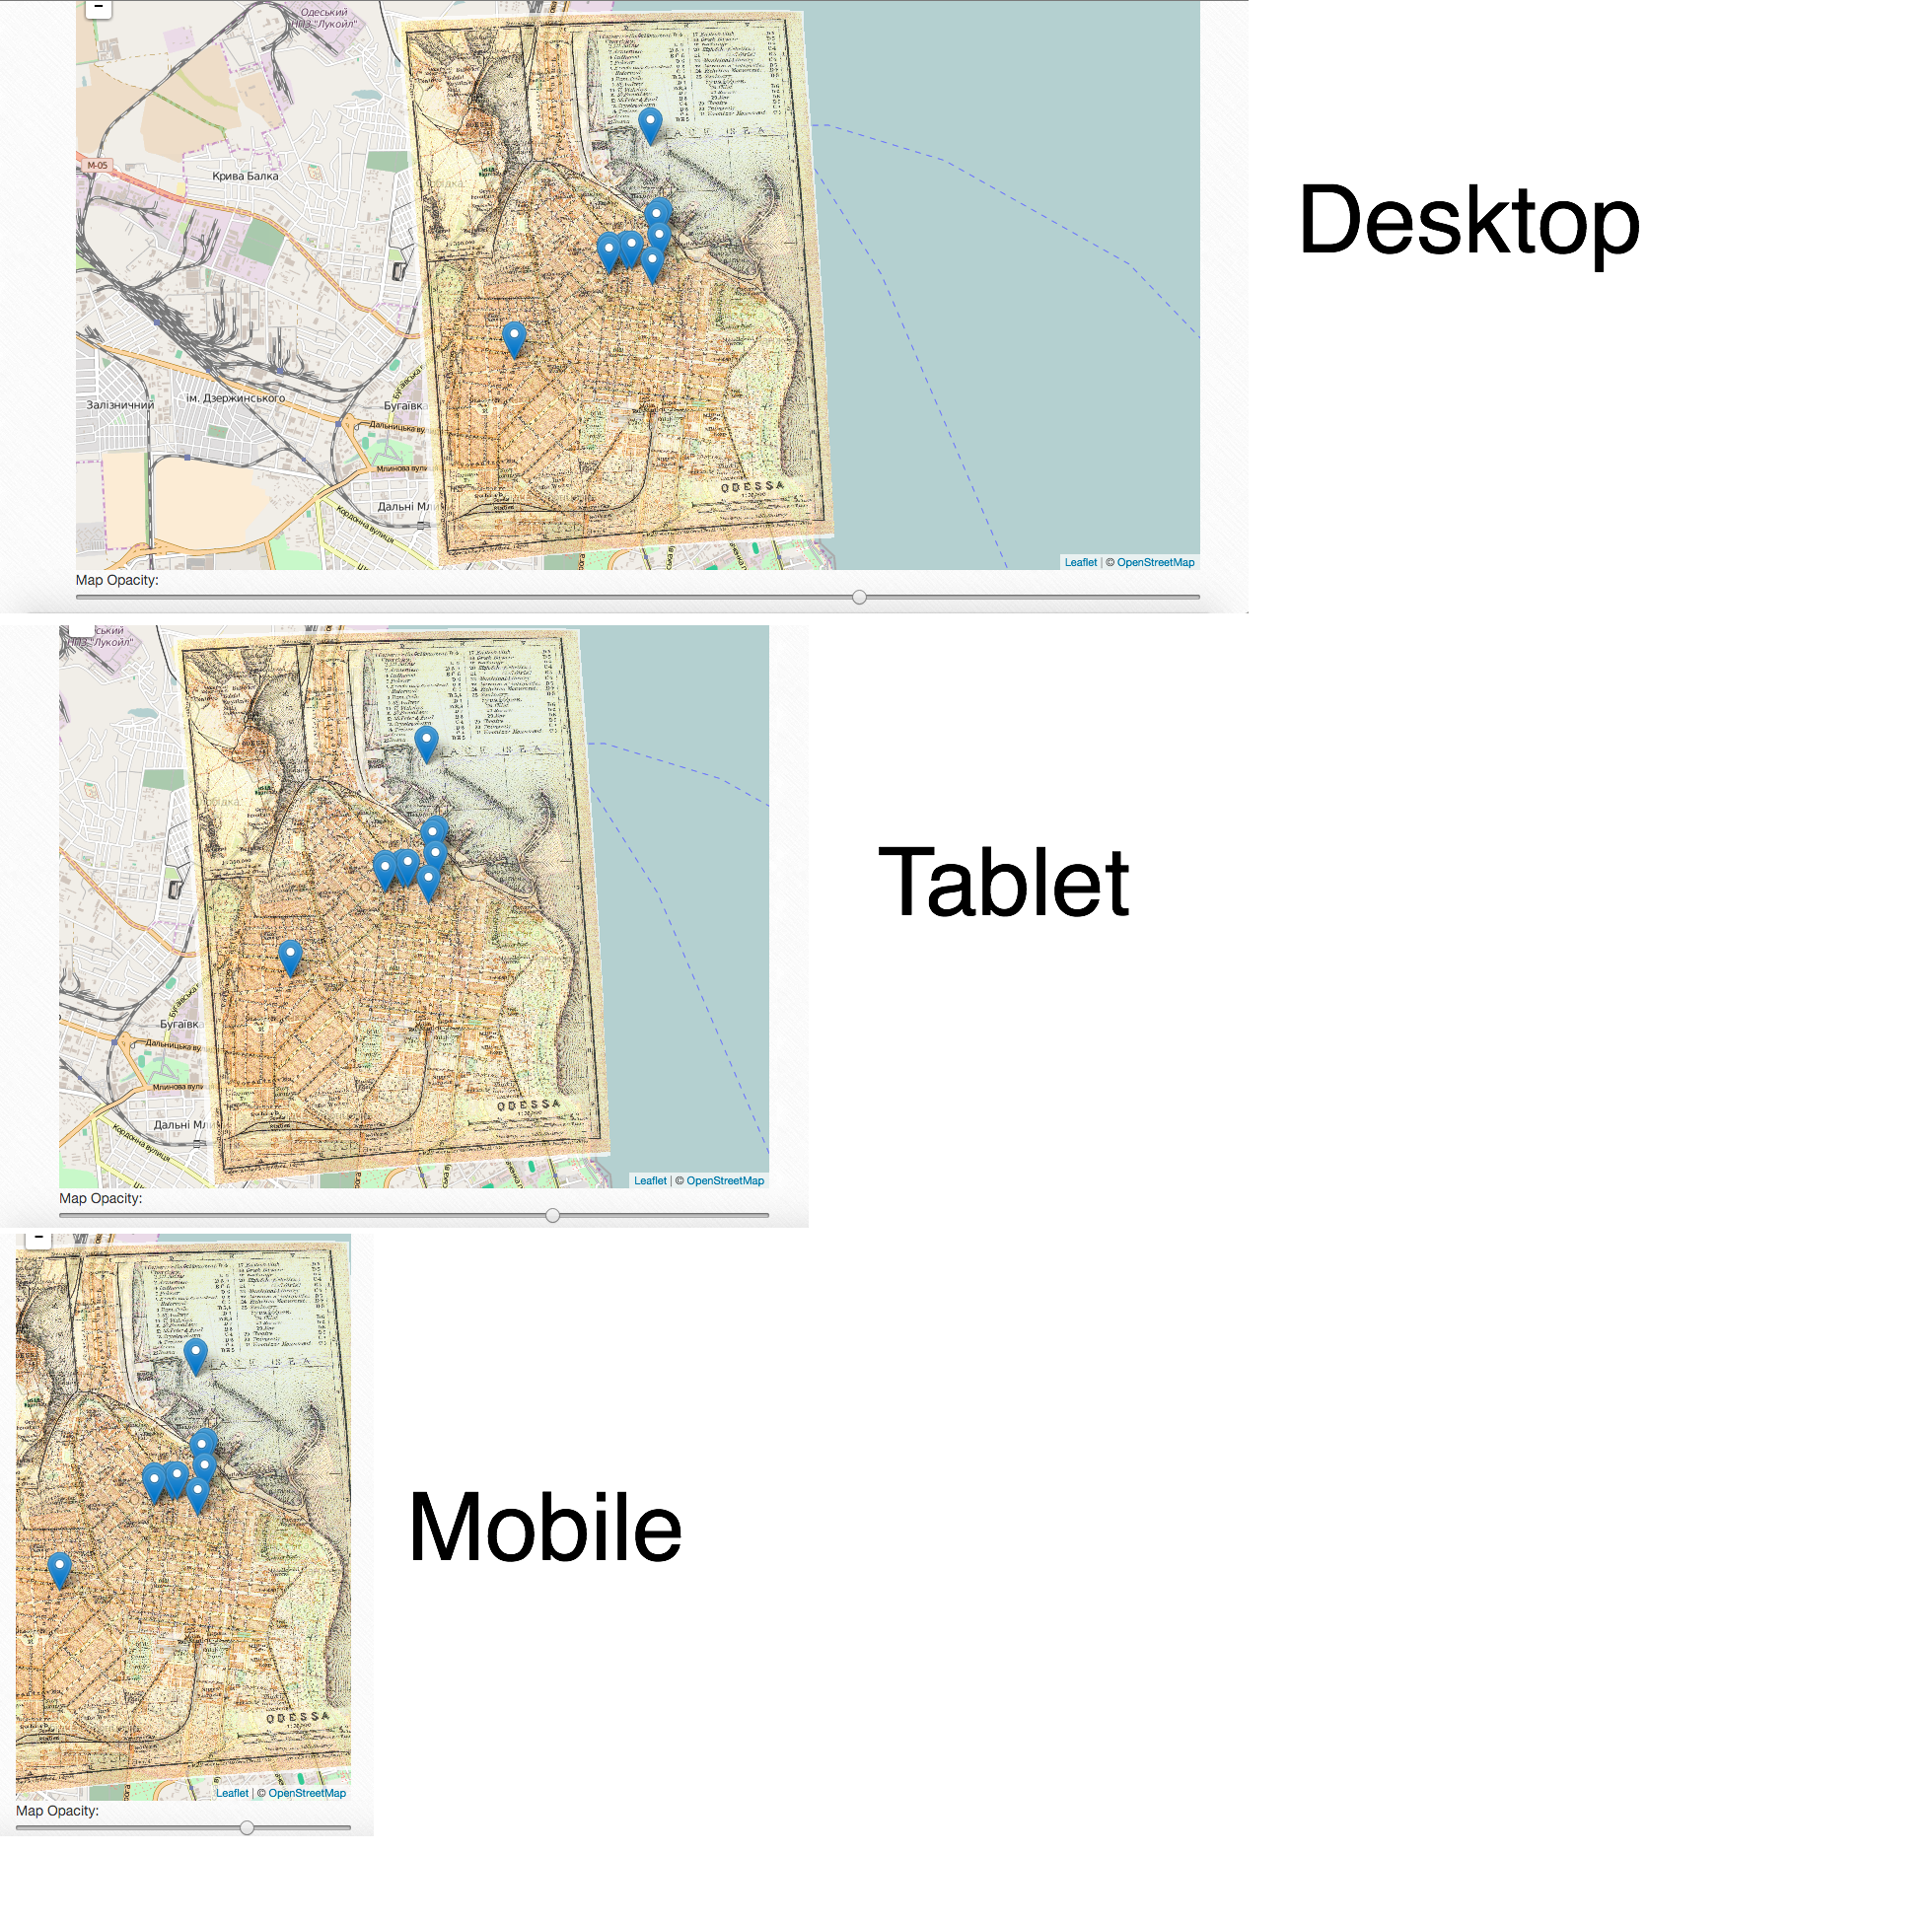
Device Accessibility & Scalable Screens
To make Django accessible through different devices, we used Twitter’s Bootstrap and integrated it into Django. If you haven’t done it before there’s a lot of great documentation on this website on how to write Bootstrap for the Django framework. By building the project this way it made the project accessible on any type of device.
Project Scalability
The last piece of the Django solution, for our team, is that Django projects are scalable. Once you get something up and started, if it has a similar framework then you can copy and paste the project to make a new one. This is useful in that you don’t have to replicate the work on the backend if you’re using the same model, but you can easily change how it looks to the users using CSS and HTML.
Helping the Researcher
Creating the project using Django helped the researcher in several ways:
Providing a Bird’s-Eye-View
The first way the Django approach helped is by providing a higher level view of the Researcher’s overall work. When the researcher wrote his book, he explained there were several ways he could have approached it. Although he had to chose one way to represent his work in the book, Django provided a way for his work to be viewed and interacted with from multiple angles. Some of these included galleries, maps, city exploration, stories of people, etc.
Organizing Materials
The second way this project helped the researcher is that it organized his materials. Before digitizing the information, everything was a stack of papers that made it difficult to sift through. By digitizing the work and bringing it online, it made it easier for the researcher, and general audience, to explore the work.
Simultaneous Work
Lastly, using Django helped the researcher, and us, because we could all work on the project simultaneously. While the researcher and his graduate assistants were uploading works into the system, the development team could work on the front end and the user interface design. While we tried not to change the Django model after the research project team started uploading the data, we still did end up changing the model slightly and had no issues with the integrations.
Other Applications For Digital Humanities Projects
This way of exhibiting and digitizing information has large scale applications on allowing researchers to share their work and disseminate information to a larger audience. Traditionally, much of researchers work has been limited to producing books or journal articles, but Django shows that there are different visual ways that can complement the traditional methods.