
This semester I’ve been playing around with Self Organizing Maps (SOMs) using the “kohonen” package in R. SOMs allow you to visualize very high dimensional data in a simplified two dimensional map which preserves proximity. I’ve written up an introductory tutorial on getting started making SOMs using the kohonen package:
https://clarkdatalabs.github.io/soms/SOM_NBA
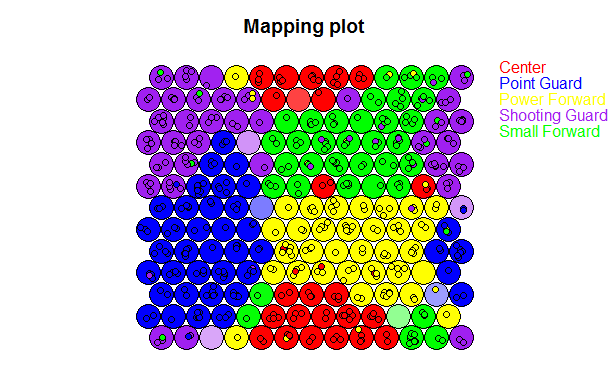
This workshop plays around with NBA player stats from the 2015/2016 season. Disclaimer: I know next to nothing about basketball.
If you like this post, keep an eye out for the next one. In the next month I’ll put out a tutorial on using SOMs to visualize the text-mined works of Shakespeare. Disclaimer: I know next to nothing about the works of Shakespeare.